Electron energy loss spectroscopy of spin waves (magnons) in ultra-thin films
Wave packets of spin waves offer the unique capability to transport a quantum bit, the spin, without the transport of charge or mass. In this context, high-momentum / high-energy spin waves are of particular interest as they permit a spin confinement within a few nanometers. However, many fundamental questions need be solved before spin waves in the high momentum regime may eventually be employed in a future “Terahertz Magnonics”. A major obstacle for a better understanding of the properties of spin waves of high momentum and high-energy is that conventional methods for studying spin waves fail in the required momentum / energy regime. Furthermore, they do not allow the study of systems with small dimensions. Here the technique of choice is inelastic electron scattering: "monochromatic" electrons are scattered from the surface of a sample and the backscattered electrons carry the information on the surface excitation spectrum (Fig. 1).

Fig. 1: Scheme for inelastic electron scattering from surfaces
Based on a long-standing tradition in the design and application of advanced electron energy loss spectrometers in Jülich we have developed an instrument which enables the investigation of spin waves in ultra-thin ferromagnetic films to be carried out. [1, 2]
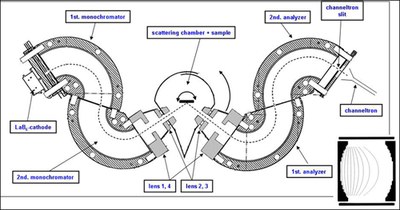
Figure 2: Top-view scheme of the electron energy loss spectrometer showing the monochromators and lens systems
Despite the low cross section for electron / solid exchange scattering, we are now in a position to observe spin waves in ultra-thin films with hitherto unprecedented energy resolution down to 4meV [3-5]. The figure below shows a sample spectrum with spin wave excitation and annihilation peaks for a 15 atom layer thick cobalt film deposited on a copper crystal. The spin wave spectrum is composed of three contributions corresponding to various eigenmodes of the film. The small vibration peak is due to a minute trace of carbon, far below the detection limit of most common surface analysis tools such as Auger-spectroscopy.
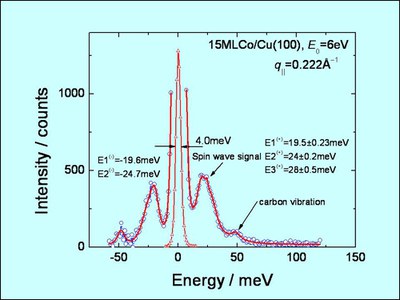
Fig. 3: High resolution spectrum of spin waves in a cobalt film of 15 atom layers thickness.
[1] H. Ibach, J. Rajeswari, C. M. Schneider, Rev. Sci. Instrum. 82 (2011) 123904.
[2] H. Ibach, J. Rajeswari, J. Electr. Spectros. Rel. Phenom. 185 (2012) 61.
[3] J. Rajeswari, H. Ibach, C. M. Schneider, A. T. Costa, D. L. R. Santos, D. L. Mills, Phys. Rev. B 86 (2012) 165436.
[4] J. Rajeswari, H. Ibach, C. M. Schneider, Phys. Rev. B 87 (2013) 235415.
[5] J. Rajeswari, H. Ibach, C. M. Schneider, EPL 101 (2013) 17003.