SIFMap: Solar Induced Fluorescence (SIF) Data Mapping
Contact: Armagan Elibol, Jim Buffat, Hanno Scharr

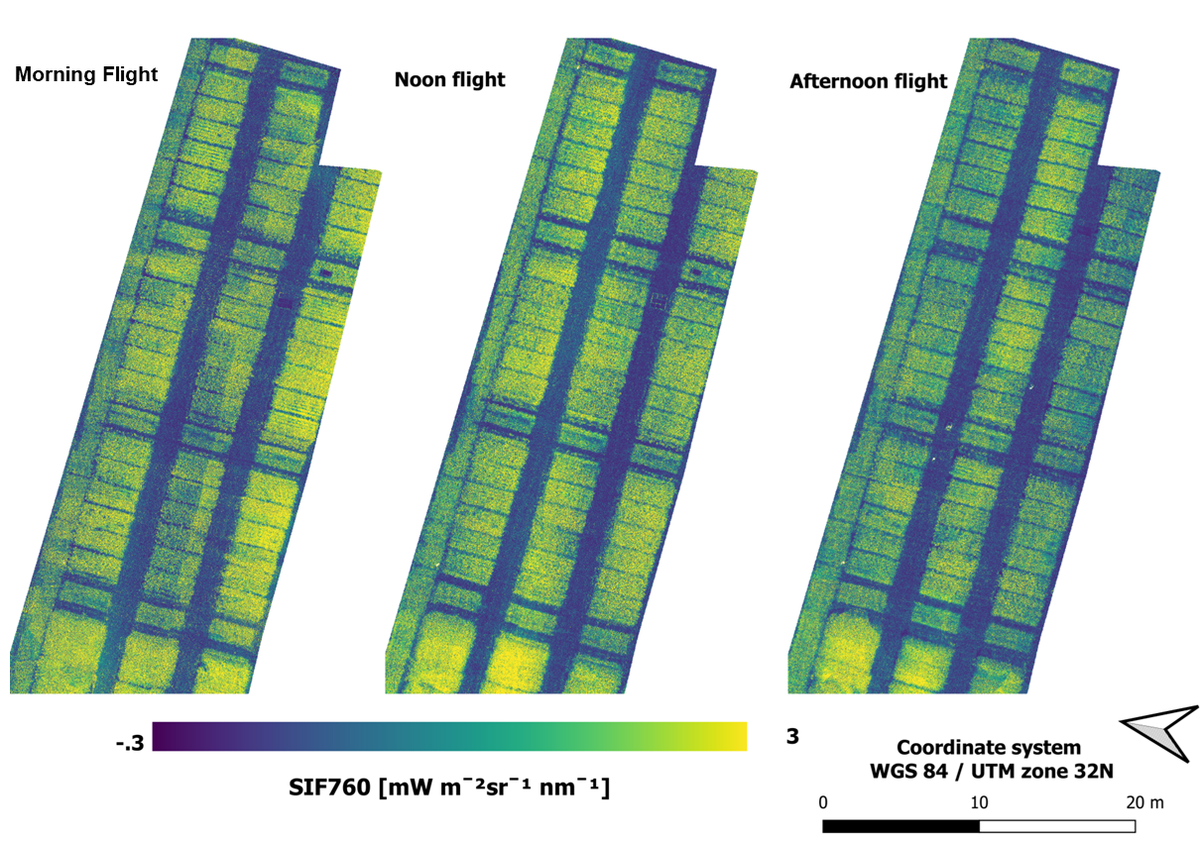
Solar-induced fluorescence or SIF is a measurement serving as a proxy of plant photosynthetic activity. When plants absorb white light from the sun, they initially absorb light across the entire spectrum. When photosynthesis occurs, some of the unused energy absorbed from the sun is emitted as heat and a red glow, or SIF.
The main objective is to create a SIF map of the area inspected from data obtained by using a UAV carrying cameras with two ultra-narrowband interference filters with central wavelengths at 757.9 nm and 760.7 nm flying over a field.

SIF Image Generation: The UAV captures images using cameras equipped with ultra-narrowband filters at specific wavelengths (757.9 nm and 760.7 nm). These images are used to generate SIF data, which represents the photosynthetic activity of plants.
Coarse Image Matching: Initial alignment is performed between multiple images, matching key features to begin creating a cohesive map.
Pairwise Image Registration: Individual images are accurately aligned with each other to ensure that the same areas captured from different angles or at different times correspond.
Global Alignment: The registered images are globally aligned to form a consistent, large-scale map that covers the entire field of interest.
Map Visualization: The final, aligned SIF data is visualized as a comprehensive map, representing the photosynthetic activity across the field.
Cooperation partners:
Saja Salattna, Forschungszentrum Jülich, IBG‐2: Plant Sciences
Juliane Bendig, Forschungszentrum Jülich, IBG‐2: Plant Sciences
Uwe Rascher, Forschungszentrum Jülich, IBG‐2: Plant Sciences
