Waves, winds and circulation
About
The circulation in the middle atmosphere encompasses three large-scale features: the stratospheric Brewer-Dobson circulation (Diallo et al. 2012; Butchart, 2014), the secondary meridional circulation associated with the Quasi-biennial Oscillation (Baldwin et al, (2001)) and the stratospheric polar vortex (Shaw and Perlwitz,2013). Winds in the middle atmosphere are driven on the one hand by temperature gradients induced by solar irradiance and on the other hand by breaking waves. A prominent example is the circumpolar westerly jet that forms in autumn, strengthens in winter, and decays in spring, known as the stratospheric winter polar vortex: When the sun does not longer reach the polar cap, the middle atmosphere cools and a low pressure system builds up above the pole. Winds are redirected by the Coriolis force, but breaking atmospheric waves slow down the winds resulting in westerlies of more than 100 m/s. However, in excessive wave breaking events the polar vortex breaks down completely. This is often followed by snow in the Mediterranean and extreme winter weather over all of Europe. For example, the ”Beast from the East” that hit the British Isles in 2018 followed a disturbed polar vortex by wave breaking. This event which affected a number of countries cost, in total, more than 80 human lives. The break down of the polar vortex known as the sudden stratospheric warming (SSW) is an example how wave driving can also induce transport across latitudes and in the vertical. In fact, the Brewer-Dobson circulation (link auf die andere Seite) as a whole is driven by breaking waves. A completely wave-driven pattern is the Quasi-Biennial Oscillation of the tropical winds in the stratosphere, which also influences weather in Europe via dynamical coupling (teleconnection). In the mesosphere the relative influence of wave driving and solar irradiance on the temperature reverses: At 90km altitude the wave driving causes the 24 hour sunlit summer polar cap to be almost 100K colder than its winter counterpart.
Waves in the atmosphere have widely varying wavelengths: Solar tides are excited by absorption of solar irradiance and are global resonance modes. Rossby waves exist mainly in the polar vortex, and Equatorial wave modes are trapped in a tropical wave guide; both have wavelengths of the order of the Earth’s circumference. In contrast, gravity waves (not to be confused with gravitational waves) have much shorter wavelengths ranging from 10km to roughly 1000km. Gravity waves are excited by wind flow over orography, instabilities of the largescale winds and convection as well as, in rare occasions, volcanic eruptions.
Research Topics
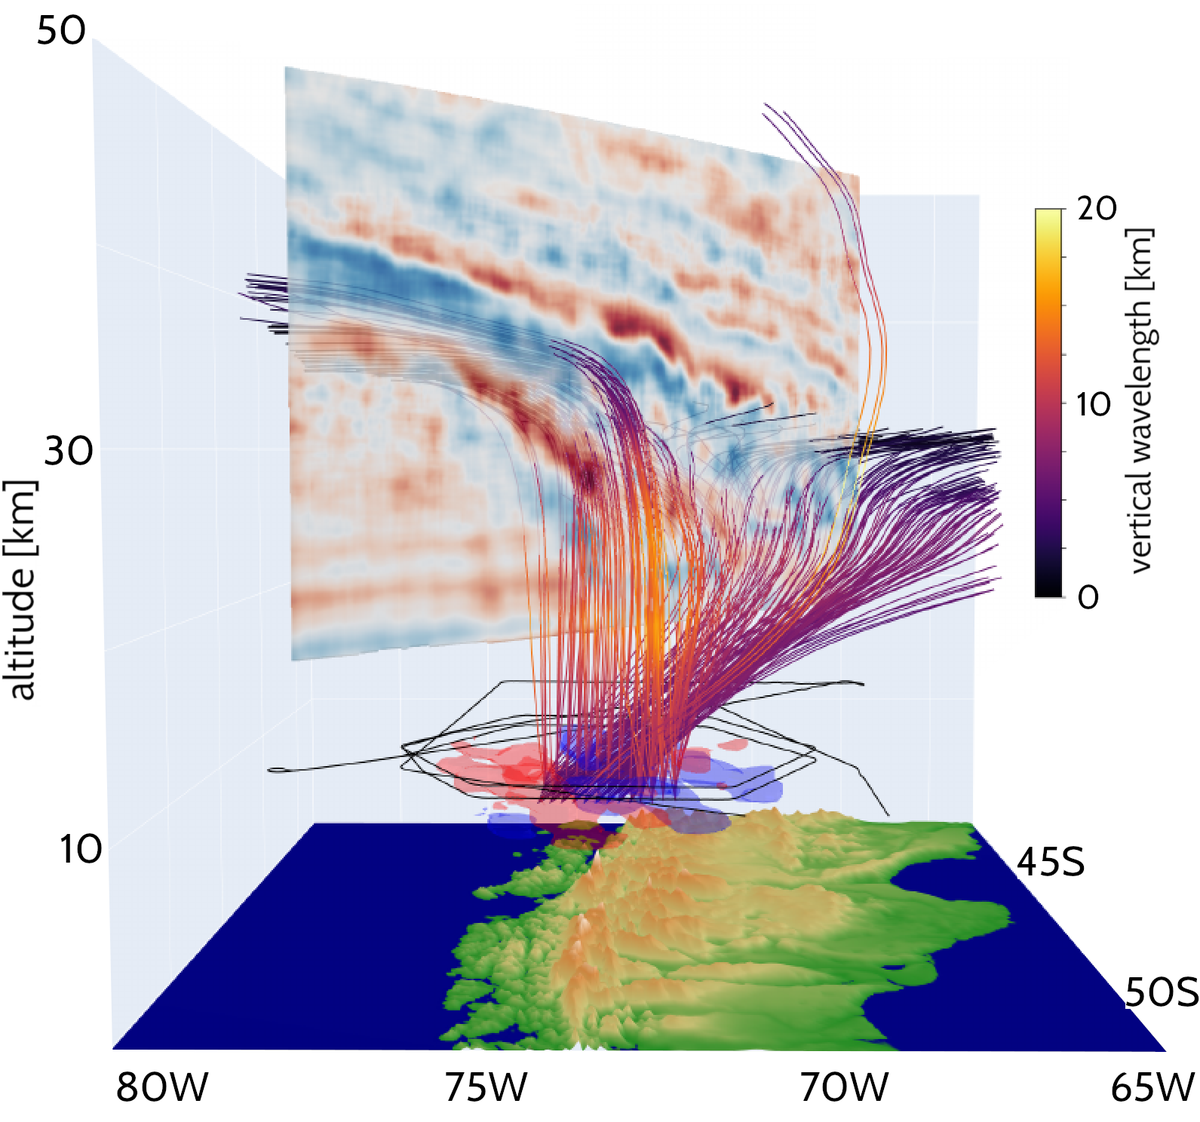
At ICE-4, we employ remote sensing data in order to measure gravity waves. A better process understanding is reached by detailed observations from the HALO research aircraft. In Patagonia, the region with most gravity waves world wide, we conducted the dedicated SouthTRAC campaign in fall 2019. In this campaign we could for a first time quantitatively confirm by observations the gravity wave ray-tracing equations formulated already in 1968.
Global distributions are inferred from satellite data. Climatologies (Ern et al., 2018;) are a reference for other observations as well as climate modelling. However, current observations are not sufficient to quantify the driving of the circulation directly. Therefore, we use the closure of the momentum balance: From the temporal change of global winds seen in reanalysis data the overall momentum deposited by the entity of all waves is determined. The contribution of the global-scale waves can be explicitly determined, so what remains has to be contribution of the small scale waves. This ”missing drag” then is compared to estimates from the satellite data.


