Annual Values
Annual values since 1961 to 2024
Graphical representation of long-term measurements
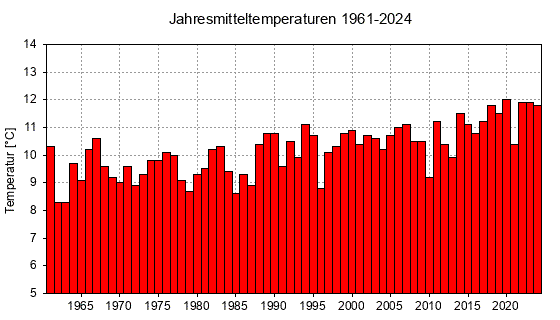
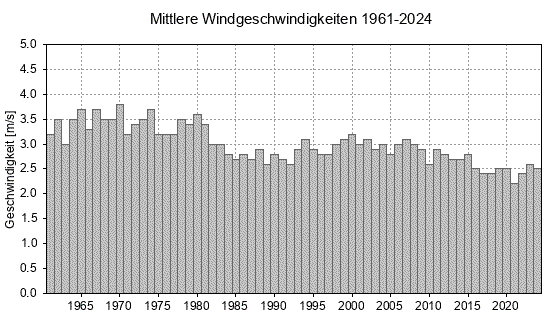
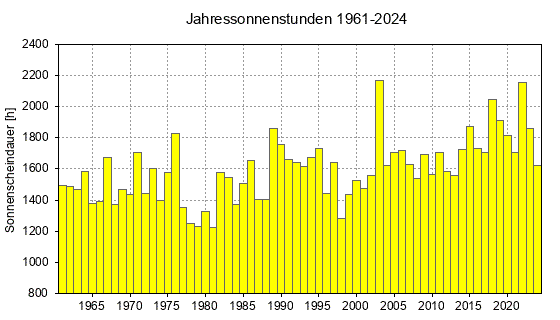
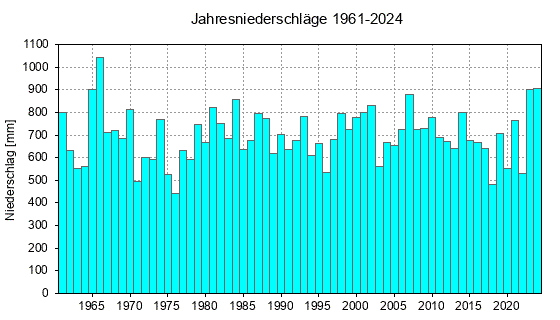
Meteorological and climatological measurements and observations have been carried out regularly at Forschungszentrum Jülich's weather station since 1961. The bar charts on this page show the temporal course of the annual
- mean temperature
- maximum temperature
- minimum temperature
- mean wind speed
- hours of sunshine
- precipitation


Contact: Dr. Patrizia Ney
Last Modified: 03.02.2025