Clinical MR-PET
Positron emission tomography is a widely used and established tool for clinical tumour diagnosis. The method complements CT and MR imaging with respect to its metabolic specificity and helps to judge the malignancy and extent of the tumour tissue. The new MR-PET hybrid technology has the advantage of measuring PET and MRI intrinsically co-registered in time and space. This reduces measurement time and greatly aids patient compliance. It enables a simultaneous acquisition of structural (MPRAGE and DTI), functional (fMRI) and metabolic (PET as well as MR-spectroscopy) data. This study demonstrates how a versatile multimodal protocol can be performed in a routine clinical set up of approx. 45 minutes scanning time acquiring PET and MR-data simultaneously.


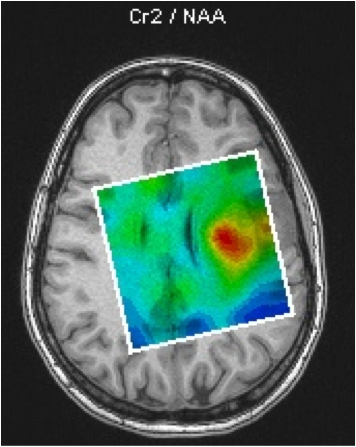
PET was performed using the amino acid O-(2-[18F]Fluorethyl)-L-Tyrosin (FET). After injection of 200 MBq FET, a combined MR-PET scan was performed on a Siemens 3 Tesla MAGNETOM Tim-Trio system equipped with a BrainPET insert. The BrainPET scan time was 45 min and MRI was performed simultaneously. The PET image volume summed from 20-40 min after injection and iteratively reconstructed comprised 153 planes with 256 x 256 voxels of 1.253 mm3. Anatomical images were acquired with a T1 weighted MP-RAGE sequence within a scan time of 9 min. The matrix size was 256x256x192 to achieve a 1mm isotropic resolution. DTI data were acquired with a double spin-echo diffusion weighted EPI sequence using GRAPPA with acceleration factor 2. The echo time was 86 ms and the repetition time was 6200 ms. Here, the matrix size was 128x128 and 50 slices with voxels of 1.9x1.9x2.85 mm3 were acquired. A total of 30 diffusion gradient directions were used with a b-value of 1000. Four averages were taken in 13 min scan time. Resting state fMRI data were acquired with spin echo EPI using echo and repetition time, TE/TR, of 30ms/2000ms. A total of 180 measurements were performed within 6 min acquisition time for 33 slices with a matrix size of 64x64 and a FOV of 192x192mm2 The DTI and fMRI data were processed using FSL. MR-spectroscopy was performed with a spin echo weighted CSI sequence with an echo time of 30 ms. A single plane for spectroscopic imaging with a matrix size of 12x12 was carefully placed in the tumour region based on the preceding acquired MP-RAGE images. For fat suppression 8 saturation bands were used and shimming was done automatically. Fused images were produced with VINCI. The patient (37 yrs, female) was diagnosed for a left frontal temporal low grade glioma and was included in a study accepted by the responsible ethic commission; she gave written, informed consent prior to participation. Figure 1 shows transverse, coronal and sagittal slices of fused images comprising MP-RAGE, DTI FA-map, resting state fMRI and FET-PET data. The MP-RAGE images are shown in the background in grey scale. A map of diffusion fractional anisotropy is depicted in red to yellow. The intensity of the measured FET-PET increases from violet to red. The fractional anisotropy within the region of increased FET uptake is reduced by 60% with respect to comparable regions on the contra lateral side. In grey to white colour coding a selected resting state default network is overlaid that is showing lateral imbalance, which is possibly due to tumour growth. MR-spectroscopy data acquired with CSI, shown in Figure 2, are based on the ratio of Cholin / NAA. The CSI results only partially match with the tumour size indicated by PET response.
