VIGAN: Visualization-guided Interactive Graph Analysis
Background and motivation
A vast number of fields in science and engineering, including neuroscience, have benefited from graph theoretic models. Insights are gained by modeling a system or data as a graph/network, and then performing analyses to identify interesting properties and relations. Such analyses are often based on algorithms borrowed from network science and/or computer science.
In terms of time and effort, this process can be very expensive due to the following reasons:
A significant amount of programming effort may be required for each project, as often custom scripts need to be written to read and manipulate data, perform analyses, and generate results.
The larger the amount of code, the more expensive it is to verify code correctness. Test effort alone can be substantial.
The more graphs have to be processed, the more often manual steps have to be repeated. This could cost large amounts of time and adds another potential error source.
In addition, there is the monetary aspect, as some of the most commonly used existing tools for graph analysis in neuroscience rely on software with a proprietary license.
Therefore, a gap exists for a free-to-use tool that minimizes programming and test effort.
Our approach
The Visualization-guided Interactive Graph Analysis (VIGAN) tool is designed to minimize the programming effort required for the exploratory analysis of graph models. We aim to achieve this by providing as many of the standard network analysis algorithms out-of-the-box as possible. Moreover, much of the functionality of VIGAN utilizes the point-and-click method, which alleviates the need to write complex scripts. Also, VIGAN is being developed as free software.
The key features that make VIGAN stand out are:
User-centered design: A programming-free interface has been a major requirement for VIGAN. Therefore, we have ensured that complex analyses can be carried out without writing any code; merely using point-and-click via the graphical user interface. Nevertheless, for Python-savvy users, all internal data objects are exposed via a Python API that can be accessed via a built-in Python code editor.
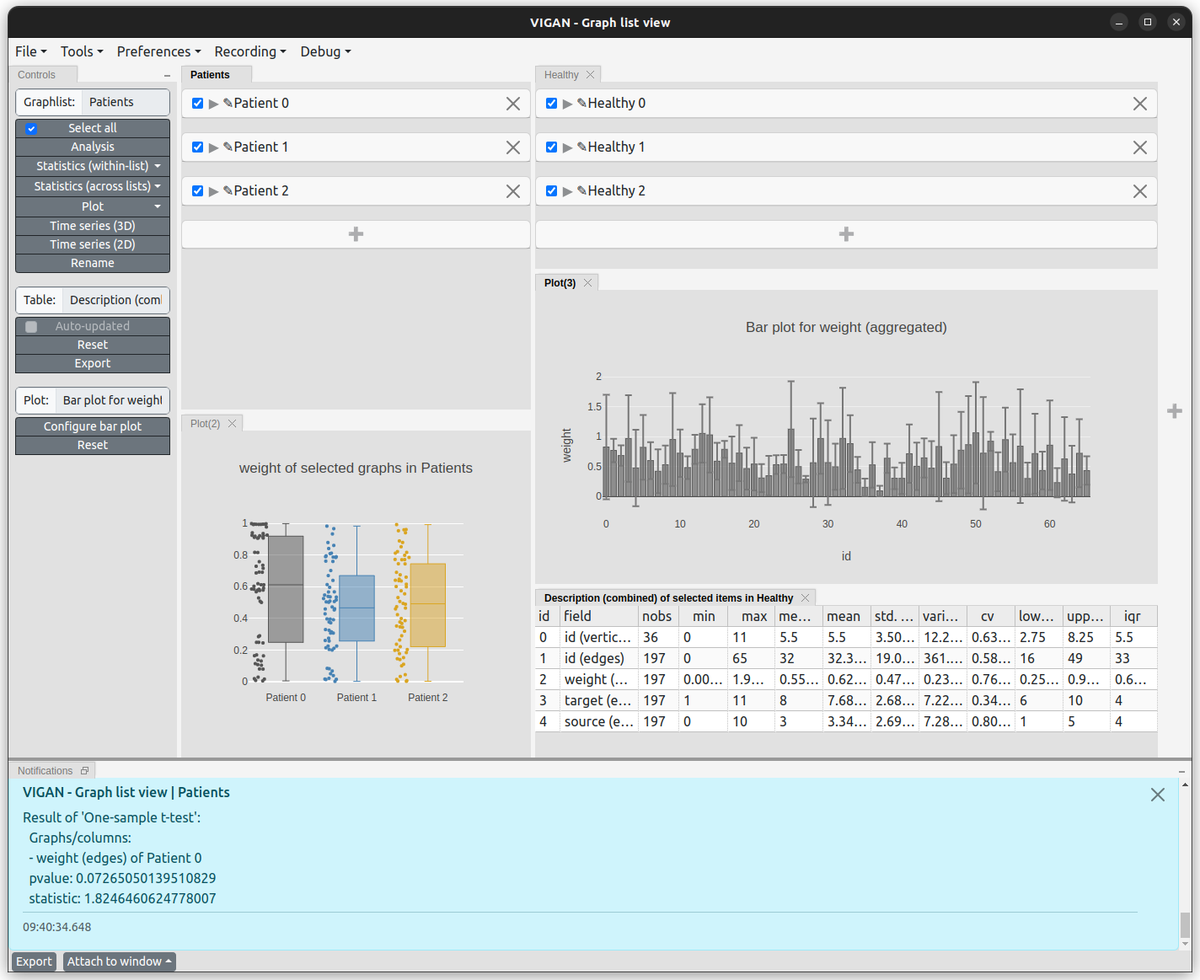
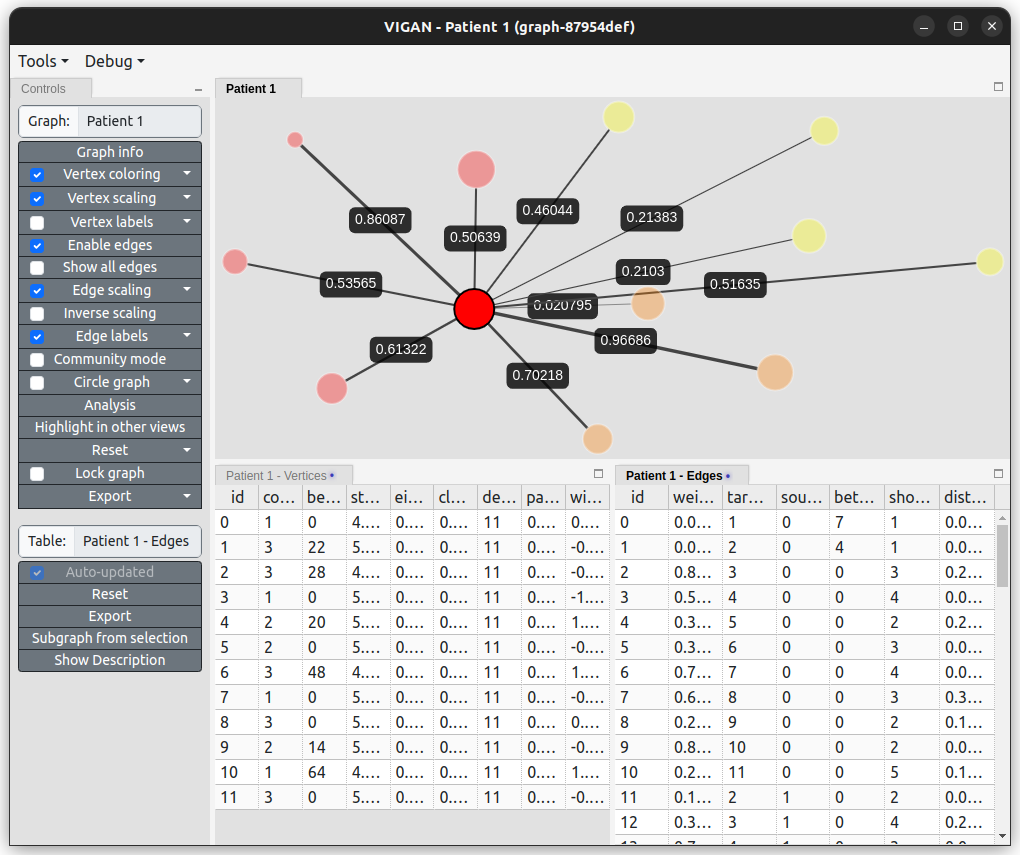
Interactive multi-view visualization: Data can be simultaneously visualized in different formats in multiple-views. Not only does each view support user-interaction for convenient data exploration, all views are optionally interconnected, e.g., clicking a data object in one view can highlight the clicked object in all other connected views. This makes it possible to easily and quickly view data from different perspectives.
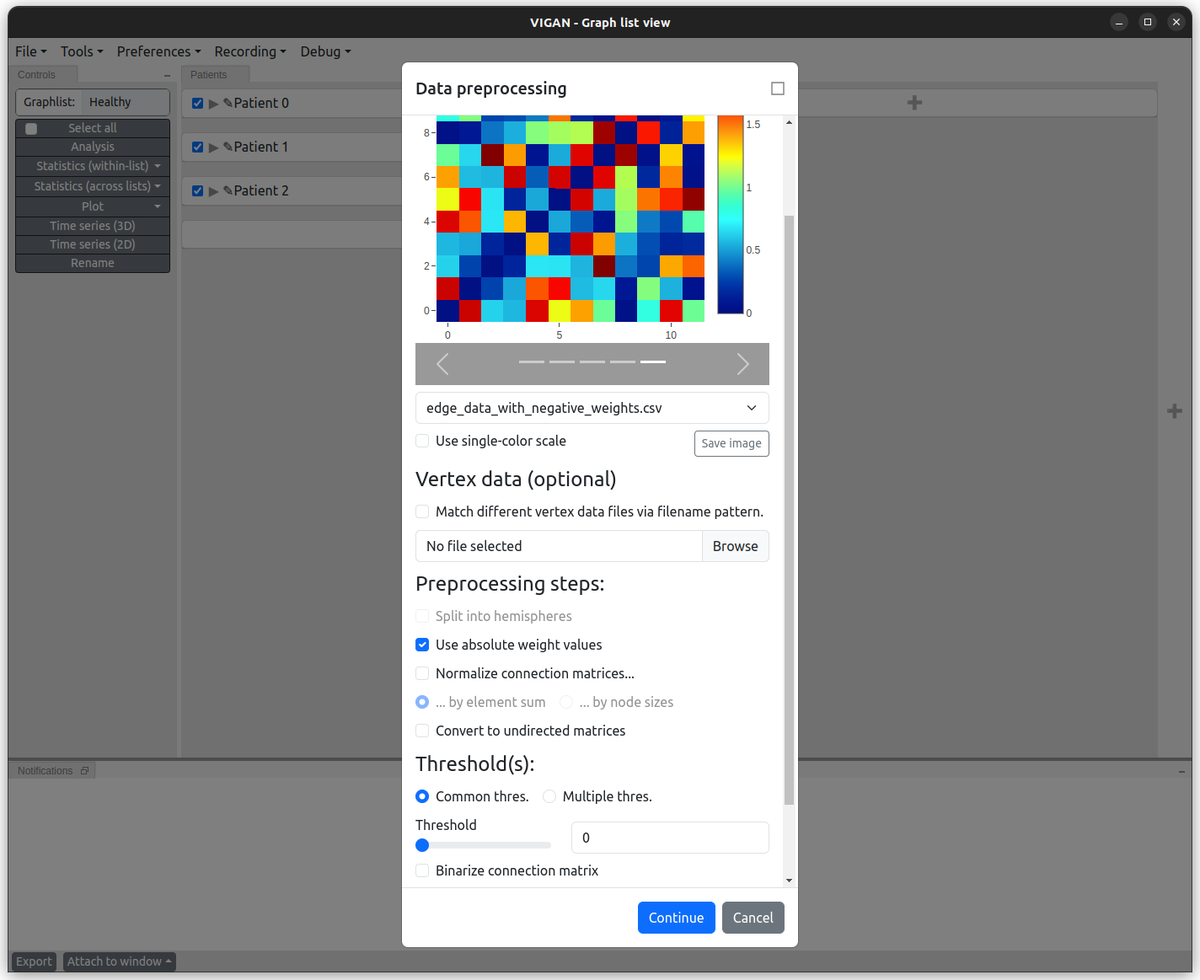
Multi-level analysis: VIGAN provides an interface that allows the user to perform statistical analysis on multiple graphs, and then dive into detailed analysis of individual graphs. This helps find the root cause for effects observed at the level of multi-graph statistical analysis. In addition, preprocessing of data is also possible.
Session recording: VIGAN enables the user to record a video of the application window during a session. Not only does this allow the user to keep a visual record of the steps taken for later reference, the recorded video can also be used as a teaching aid, or sharing the analysis steps with other colleagues.
Save and resume application state: The user can save the application state at any time and resume work from the same state at a later time; even on a different computer. This makes it possible to continue analysis despite interruptions.
Extended logging: Provenance tracking is made possible via logging of all user actions per session.
A brief walk-through of interactive exploratory analysis with VIGAN
Note: For brevity, only a subset of available features has been presented in the above example. E.g. not shown here: Advanced filter (run custom python code), 3D view, time series view, ...
Current status
We are actively developing VIGAN, and therefore look forward to hearing from interested users. Should you find VIGAN a potentially useful tool for your research, please do let us know.
Our collaboration partners
This application is being developed in collaboration with the Computation in Neural Circuits group of the IAS-6 and the Clinical Cognitive Sciences
group at UK Aachen.