Access to Job reports for JSC systems
Useful Links
LLview
LLview is a set of software components to monitor clusters that are controlled by a resource manager and a scheduler system. Within its Job Reporting module, it provides detailed information of all the individual jobs running on the system. To achieve this, LLview connects to different sources in the system and collects data to present to the user via a web portal. For example, the resource manager provides information about the jobs, while additional daemons may be used to acquire extra information from the compute nodes, keeping the overhead at a minimum, as the metrics are obtained in the range of minutes apart. The LLview portal establishes a link between performance metrics and individual jobs to provide a comprehensive job reporting interface.
The LLview Job Reporting web portal provides:
- job list tables, containing their aggregated performance information (for jobs that are running or have already finished within three weeks);
- timeline graphs per job for the key performance metrics;
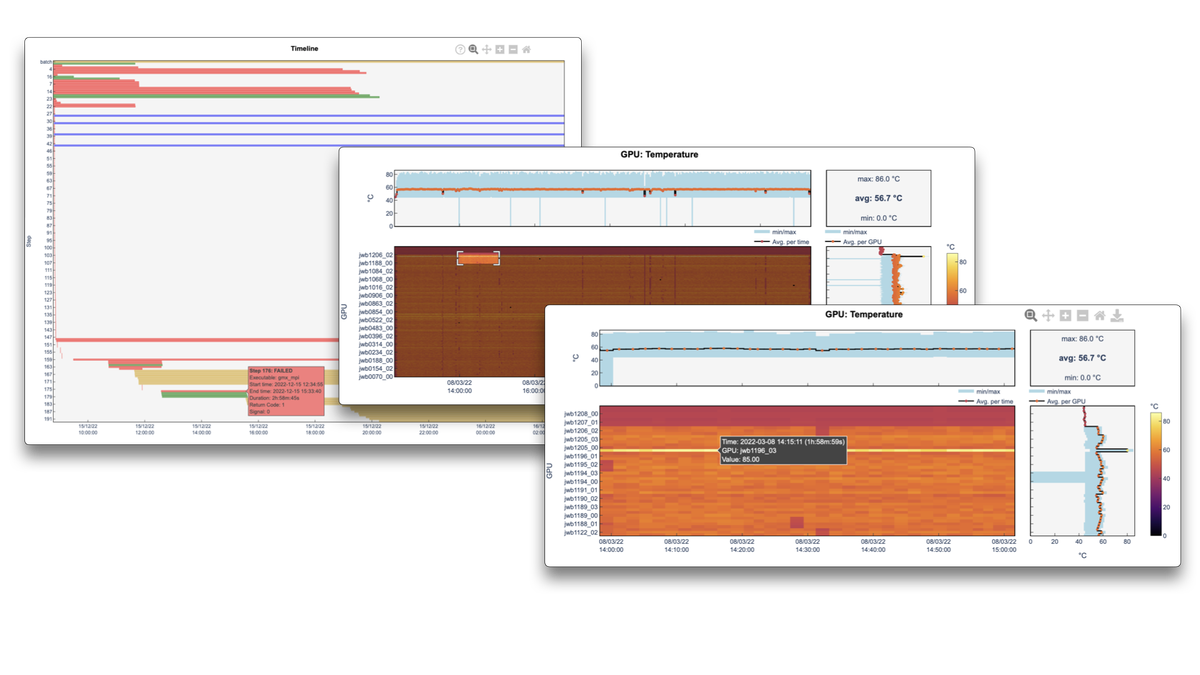
- access to detailed job reports, including an interactive report or a static PDF version;
- role-based access to different levels of information;
- live view of the system;
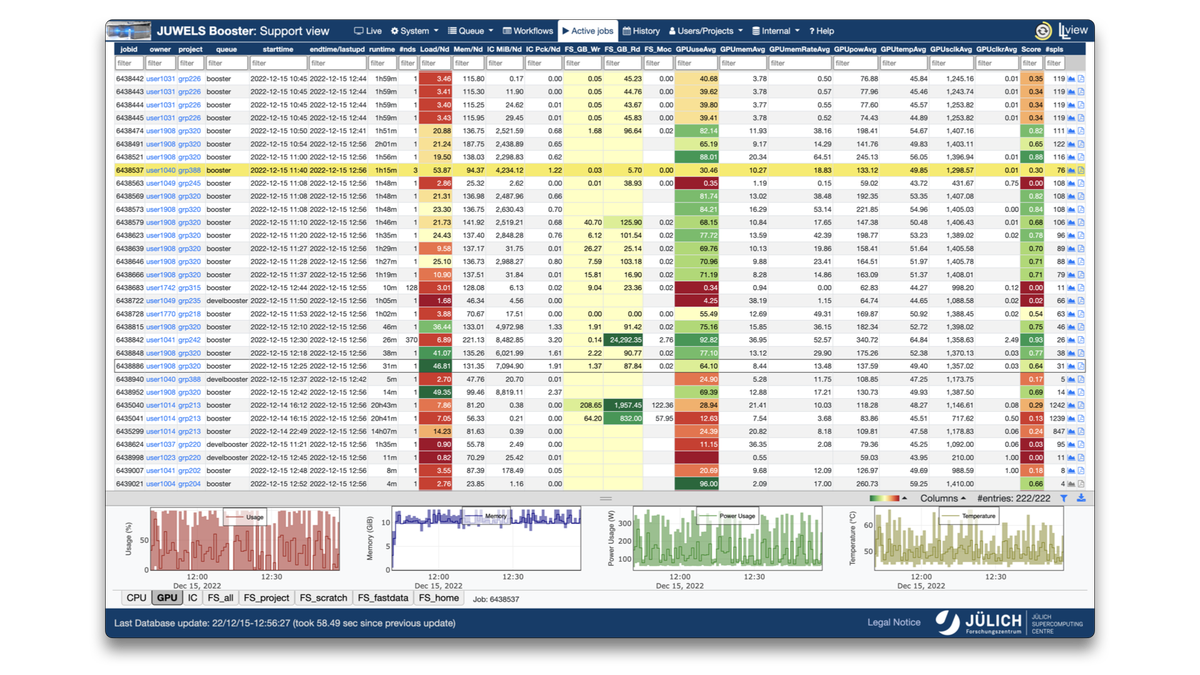
Job Reporting
The job reporting interface of LLview web portal comprises, for each job:
- basic information (as job ID, username, project, start and estimated end time, etc.);
- aggregated metrics for different quantities (some of them color-coded to indicate good or bad values);
- job error indicators;
- links to the detailed job report.
The job list can be filtered and sorted by different quantities. Moreover, when a job is selected, graphs for key performance metrics are shown at the bottom of the screen, with average, minimum and maximum time series. All metrics in job reporting are gathered on a minute basis, such that jobs running for more than two minutes runtime are covered.
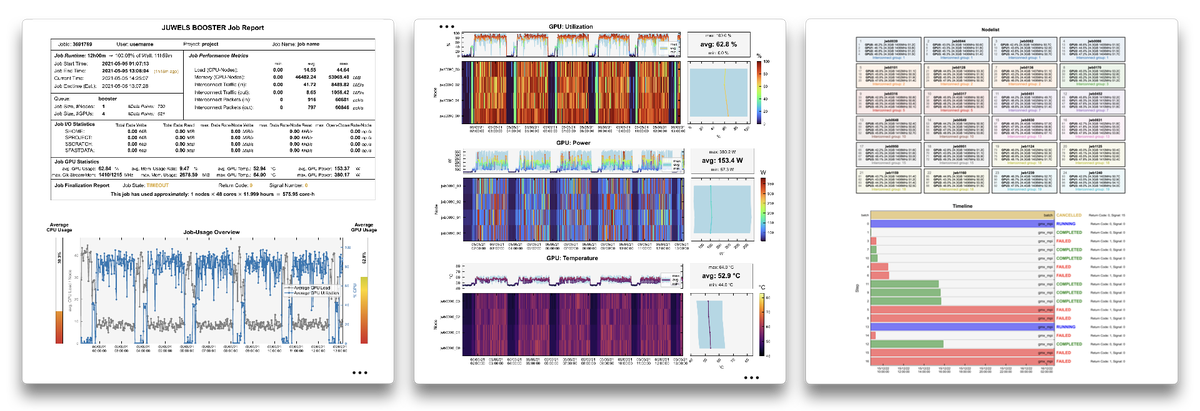
Detailed interactive web-based and PDF reports are generated and linked on the right-most columns of the job list. The visual display helps users and administrators to identify behaviours, problems and bottlenecks on the different jobs.
On the web-based report, the graphs display information on the points when hovering the mouse pointer. They may be zoomed and shifted, and data for each graph may also be downloaded in the JSON format.
Job reports are stored for three weeks and may be accessed via the "History" tab. Afterwards, the information is archived and not accessible by the user any more.