MapMan | Visualize Plant Omics data
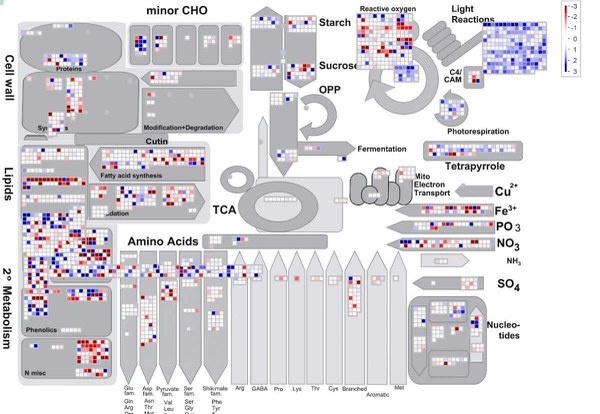
MapMan visualises data from gene expression analyses. Genes or proteins with a common function (for example in the same biosynthetic pathway) are visualised and evaluated together. Mercator assigns the annotations for this. Changes in processes and pathways can be revealed, visualised and evaluated quantitatively.
Visualisation with MapMan:
Link to the download and to further informations: Mapman
Contact: Sebastian Beier
More Informations:
MapMan4: A Refined Protein Classification and Annotation Framework Applicable to Multi-Omics Data Analysis Rainer Schwacke, Gabriel Y. Ponce-Soto, Kirsten Krause, Anthony M. Bolger, Borjana Arsova, Asis Hallab, Kristina Gruden, Mark Stitt, Marie E. Bolger, Björn Usadel
Molecular Plant, Volume 12, Issue 6, 879 - 892
Last Modified: 17.08.2023