Modelling for Cleaner Waters
In deutschen Flüssen und Seen ist zu viel Phosphat, das schadet den Ökosystemen. Deutschland will die Orientierungswerte bis 2027 in allen Gewässern einhalten. Ein Simulationsmodell aus Jülich hilft dabei.
Around 25,000 tonnes of phosphorus seep into German rivers and streams every year through the use of fertilizers and sewage treatment plants. This has a number of consequences. According to the German Federal Environment Agency, concentrations of phosphorus are too high at more than half of all measuring points in Germany. Just tiny amounts of this nutrient are enough to stimulate plant growth – for example, one gram can cause around 100 grams of algae to grow, which sometimes leads to significant ecological problems, such as fluctuating oxygen levels that threaten fish and microbes.
Phosphate concentrations decreased significantly, particularly in the 1980s and 1990s, because sewage treatment plants were technically refitted and maximum levels for phosphate were set for products such as detergents and cleaning agents. However, this still isn’t enough. Phosphorus pollution is partly responsible for the poor ecological condition that 90 % of surface waters in Germany are currently in. However, the European Union’s Water Framework Directive (WFD) aims to ensure that "good status" of these waters is achieved by 2027.

Die Wege des Phosphors aufdecken
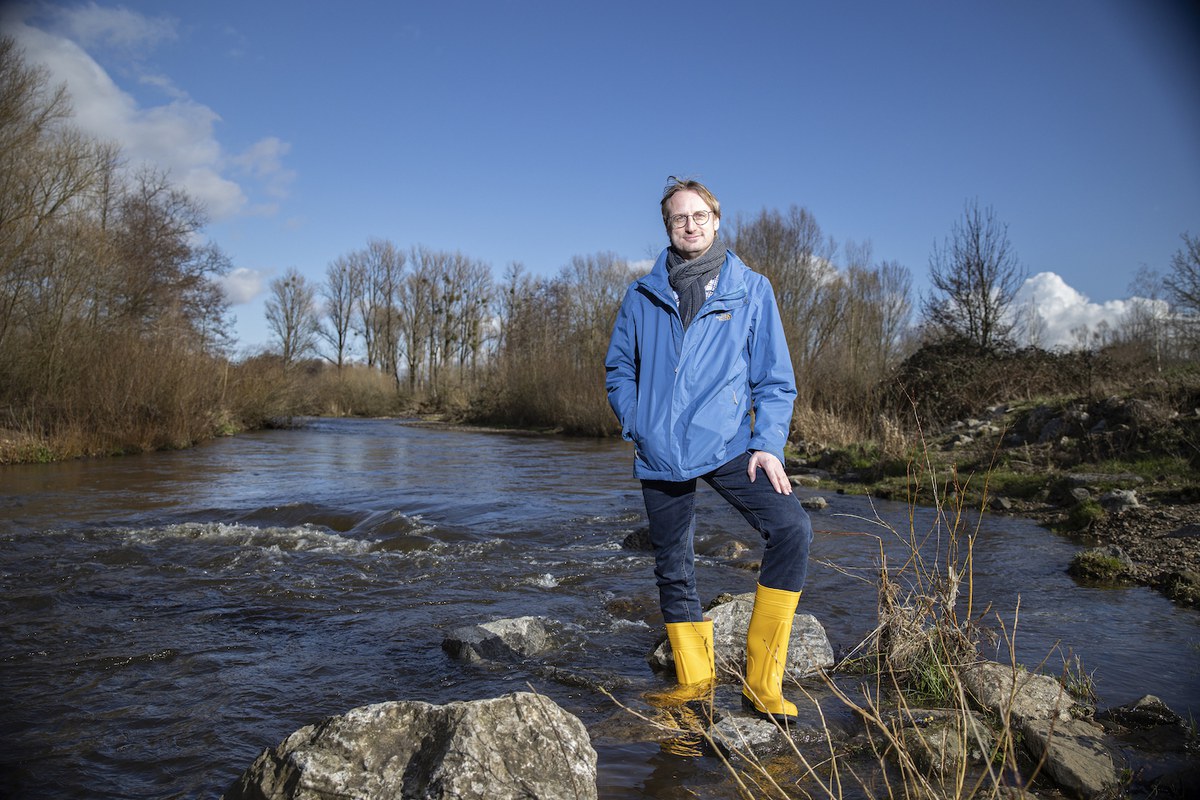
“To determine the phosphate concentrations in every region, measuring points alone are not enough,” explains Dr. Björn Tetzlaff from the Institute of Bio- and Geosciences (IBG-3). He developed a model called MEPhos around 15 years ago, which can be used to determine the phosphate pollution in surface waters and its causes. It can precisely calculate the sources of phosphate pollution in a particular section of a river and the route the nutrient took to get there. The continually upgraded model has been in use for ten years in Hessen and Schleswig-Holstein. Now, it is being used in nine states and at the federal level.
MEPhos uses geodata on soil, rock, and relief, as well as climate data and phosphate input measurements as the basis for calculations. The majority of the phosphate can be traced to wastewater from sewage treatment plants or the use of fertilizers in agriculture. Additional sources include industrial facilities and even natural sources, such as rock containing phosphate (see image). To check how well the model calculations line up with reality, the researchers compare the simulated phosphate values with those from the measuring points in rivers and streams.

Regional differences
FThe simulations for the state of Hessen showed that municipal sewage treatment plants are responsible for the largest share of phosphate pollution in surface waters. “That means this is by far the most important element to work on,” explains Tetzlaff. However, there are major regional differences, which is why it is not enough in some districts in Hessen just to improve sewage treatment plants. That is one reason why the Jülich researcher warns against generalizing results – for example extrapolating results from one state and applying them to another state or even to all of Germany. In Schleswig-Holstein for example, the situation is very different from that in Hessen. Calculations with MEPhos showed that agricultural sources play the key role there. “Here, the farmers need to be held accountable,” he says. Nevertheless, old sewage treatment plants should of course also be technically refitted should they represent a significant source of phosphate in a section of river.
Calculated savings
Using a combined model system consisting of MEPhos and the GROWA model – which was also developed by Jülich researchers and takes the entire water balance of a region into consideration – it is possible to break down the distribution of phosphate in even more detail. The map of Schleswig-Holstein that this system produced shows that the phosphate pollution was too high in more than half of the analysed areas (see figure). “The analysis allowed us to show emission sources and to calculate the amount by which the phosphate input has to be reduced in order to reach certain target concentrations in rivers or lakes,” says Tetzlaff. According to the calculations, there needs to be 269 tonnes less phosphorus entering the bodies of water in Schleswig-Holstein each year to comply with the EU’s figures. This is equivalent to a third of the current total emission.

Suggestions on where measures should be implemented to improve the water quality are in high demands. Jülich’s water expertise is regularly called upon by federal and free states and the Federal Environment Ministry (BMU). In the long term, the goal is to use MEPhos to acquire national data for phosphate pollution. “Our model supports the authorities to achieve the environmental quality targets specified in the WFD,” Tetzlaff says enthusiastically. Sometimes working to protect the environment starts at a computer.
Janosch Deeg
